
Like walking in the woods or navigating a new city, you need guidance to get your project where it needs to be.
That’s what process mapping is for. This flowchart can tell you where you are, where you’re going, and what steps your team needs to take to finish your project. Creating one before diving in preps you for the process and gives you something to refer to if you get lost — so if you do take a wrong turn, you know how to get back on track.
What’s process mapping?
A process map is a flowchart that defines what activities and tasks you need to complete and when. Also known as a workflow process map, workflow diagram, or process flowchart, this document lets team members visualize and plan the course of a project.
Process maps aren’t just for reference. They give your team the gift of foresight, efficiently communicating the outlook of a project using visuals instead of heavy text.
Teams generally use process workflows in situations that need step-by-step action. You could use a map to chart improvements, plot a project, or run an analysis on an issue — any to-do that requires a defined process.
Workflow process mapping symbols
As visual tools, process maps rely on symbols to signify actions and their connections. Here’s what each shape in a process map usually means:
Rectangles — rectangles represent activities or steps. In a marketing process map, a step could be generating the text of a campaign email, and the next one could be sending that email.
Arrows — arrows show the workflow’s direction. Not every flow is straight; at some junctures, there might be different ways to turn, or one task could flow into several. After sending a campaign email, that task might flow both into a follow-up with those who opened it and different actions with those who haven't.
Diamonds — diamonds signify decision points. In these moments, your team will plan on making a call, like running another marketing campaign or shifting the approach.
Oval — ovals mark the beginning or end of a process. In this marketing email example, the endpoint might be the completion of the advertising initiative.
Why use process maps?
A well-organized plan helps any project, and process mapping visualizes that plan. It’s simpler than a workplan, giving you a holistic overview of your process in just one doc.
Here are more ways process maps can help:
Plans projects — when you commit project ideas to writing, you visualize successes, roadblocks, and failures before they occur. Maybe you’ll start mapping your process and find a missing step you didn’t see earlier. That’s the benefit of planning ahead.
Simplifies communication — creating clear visuals helps teams understand a project before discussing the particulars. Giving everyone access to the map prevents silos and keeps them on the same page.
Illustrates a project’s phases — a map lets you divide your project into distinct phases or sprints, helping your team complete key deliverables on time.
Speeds up processes — laying every step and checkpoint in front of you gives you the chance to identify inefficiencies, like unnecessary and double work.

Types of process maps
Teams often call process maps flowcharts because that’s the form these maps commonly take. But there are several types of process map, each serving a slightly different purpose. Here’s more on the five primary types:
Flowchart — a flowchart uses the symbols we discussed above to map a project's inputs and outputs along with the workflow's direction. This usually doesn’t include in-depth explanation, but it might link out to wikis and other docs to further explain different steps.
Detailed process map — a detailed process map explains every step and checkpoint, showing subprocesses for each one. It could take the form of an extended flowchart or a text-based document that connects to your project plan. Because of its larger scope, a detailed process map can better identify inefficiencies and potential roadblocks.
High-level map — a high-level map gives you a bird’s-eye view of a process. These maps don’t get into the nitty-gritty, but like flowcharts, they help teams define plans and track progress.
SIPOC diagram — a SIPOC diagram details these five categories of information: suppliers, inputs, process, outputs, and customers. You can use them to categorize different processes before planning a project, like the steps for choosing suppliers and defining deliverables.
Cross-functional flowchart — also known as swimlane maps, these flowcharts assign tasks to responsible team members. They encourage accountability and show exactly who’s working on what and who’s collaborating on certain steps.
How to create a process map
If you can plan it, you can map it. Even if creating a process map isn’t a regular step in your workflow, it’s something to try — especially if you’re struggling to keep track of to-dos and pinpoint what comes next once you cross them off.
Here’s how to fit your project into a process map:
Identify the process — the first step in any workflow or business process mapping journey is identifying the “why.” Detail your end goal, whether that’s to improve a current operational process, create a new product or service, or fix a glitch.
Define milestones — before you start mapping, break your final goal down into the deliverables you’ll need in order to complete it. This is also a good chance to decide who’s responsible for what deliverable.
Identify the steps — define every step it’ll take to cross off milestones and complete tasks. If you plan on creating a detailed map, gather the docs you’ll need to present all relevant information.

Select a type of map — select the right kind of map for your project and focus. If you want to encourage accountability from team members, create a swimlane map that assigns work to individuals. If you need a simple overview to share with end users so they can visualize the project flow, use a high-level map. You can also combine a few.
Draw your flowchart — draw your chart using symbols to denote inputs, decision points, and the direction of the workflow. Consider using a template to scaffold your map. As you perfect the chart styles that work well for your organization, save them so you can make duplicates as needed.
Share your chart — share your flowchart with key stakeholders and gather feedback. This doc is for your whole team, so your whole team should have input. This lets you make potential changes before you start work. It’s your chance to remove redundancies, adjust timeline issues, and define any unclear roles.
Sign off — once you’ve completed the process map, ask everyone to proofread and sign off on it. It’s a simple but vital step, keeping everyone aligned before your project even starts.
Process mapping example
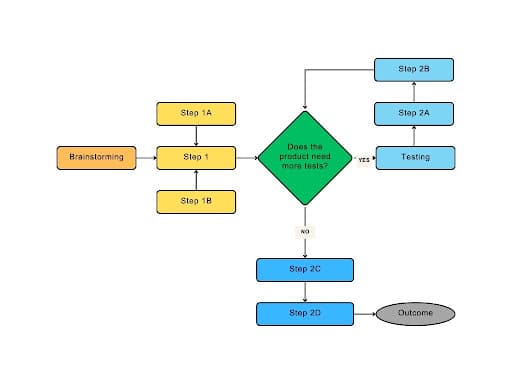
No process is the same, so there’s no end-all-be-all example to follow. But these process maps can give you an idea of what to include and how to design a journey that works both for your project and your team.
Example 1
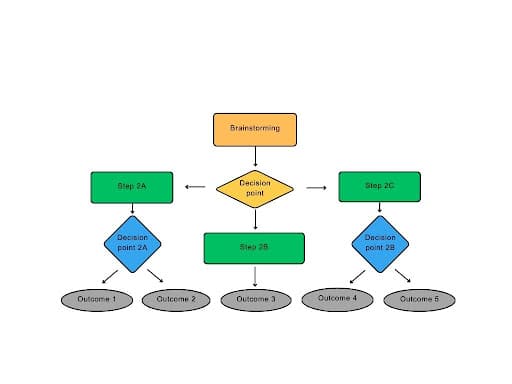
Example 2
Improve your workflow with Notion
When it comes to launching a new project or process, a map is just the first step. Use Notion to design a connected workspace for your team and host all the docs and notes you need to get the job done.
Map out your user journey, set project goals, and visualize the way forward with a roadmap template. Plot your project on a timeline and hit every deadline. It all happens in Notion.
